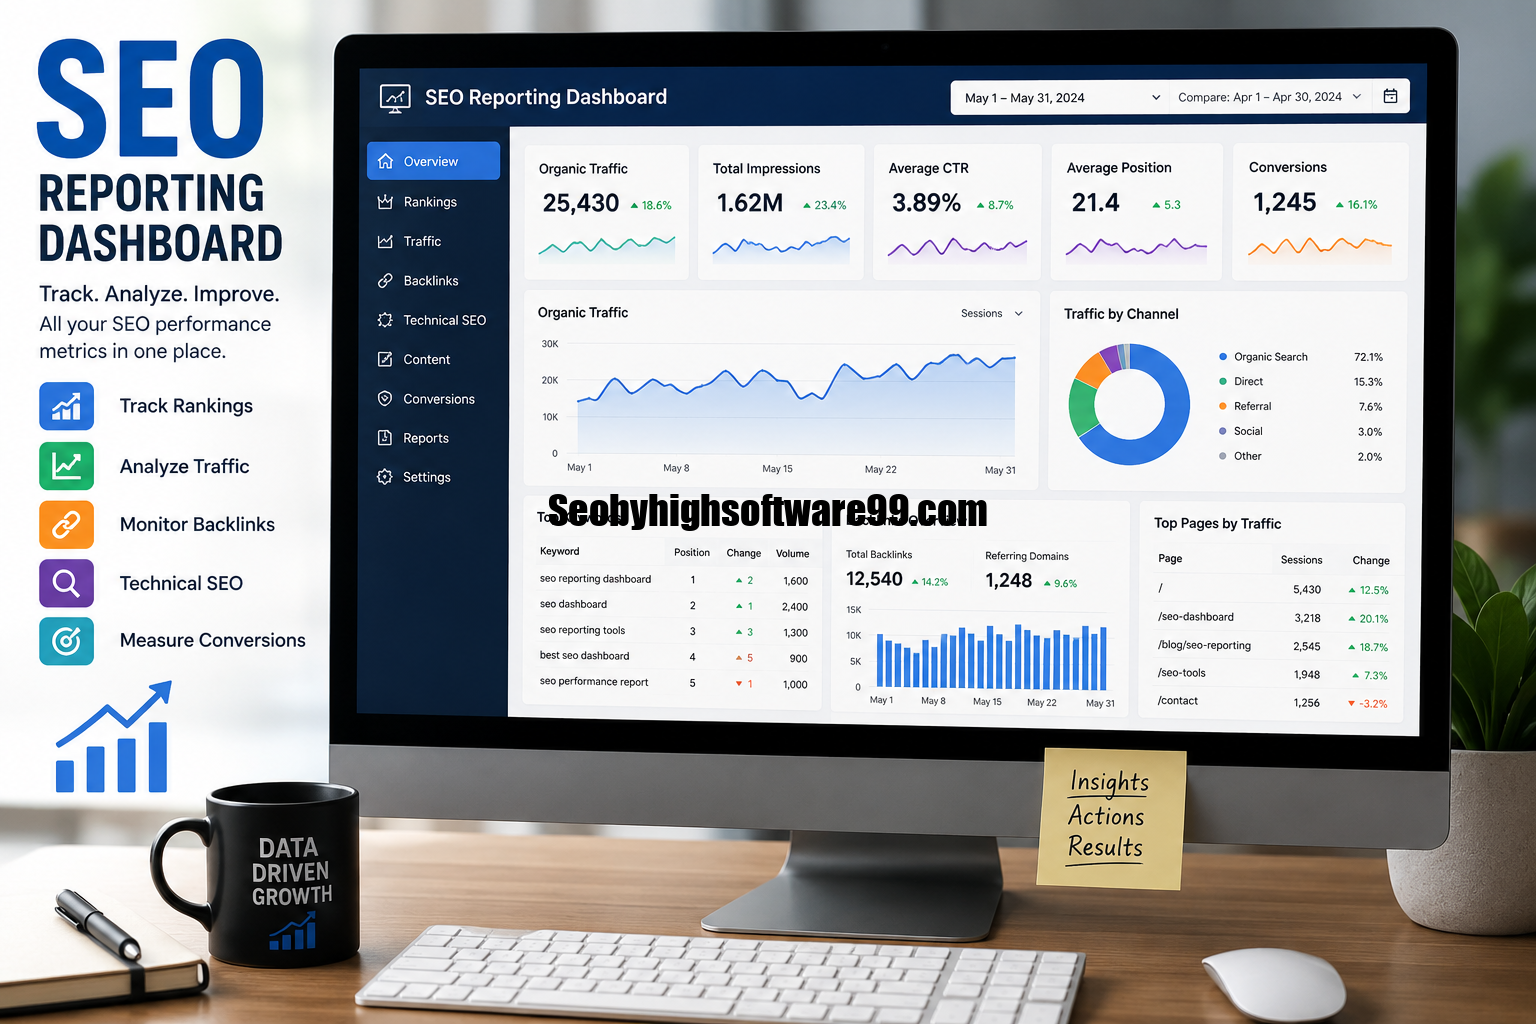
SEO Reporting Dashboard: Tracking and Improving SEO Performance
Search engine optimization is no longer about simply adding keywords to web pages and waiting for rankings to improve. Modern SEO involves technical optimization, content performance, backlinks, organic traffic, user engagement, conversions, and many other factors. Because there is so much data to monitor, SEO professionals need an efficient way to organize and understand their results.
SEO reporting dashboard provides a centralized place where important search engine optimization data can be collected, monitored, and analyzed. Instead of checking multiple platforms separately, marketers can use a dashboard to view essential performance metrics in one organized interface.
A well-designed SEO reporting dashboard does more than display numbers. It helps businesses identify trends, discover problems, measure progress, and make better decisions. Whether you manage a single website, work for an agency, or handle SEO campaigns for multiple clients, the right dashboard can make reporting faster and more useful.
What Is an SEO Reporting Dashboard?
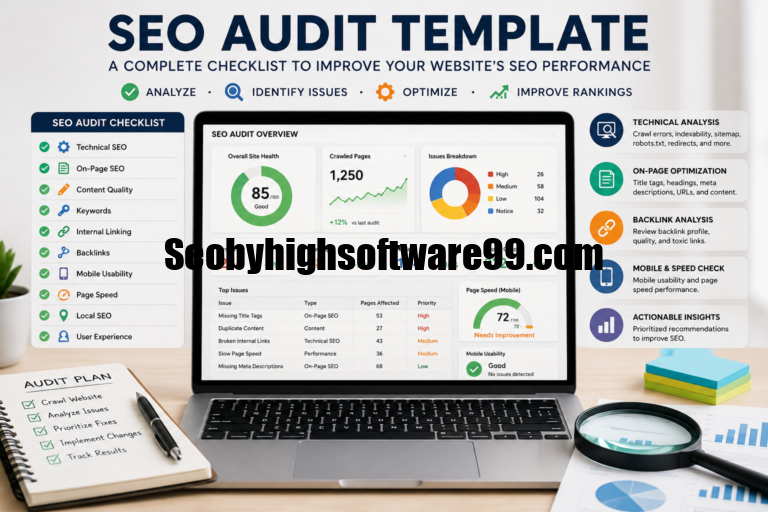
An SEO reporting dashboard is a visual reporting system that brings important SEO data into one location. It can combine information from tools such as Google Search Console, Google Analytics, keyword tracking platforms, backlink tools, and website auditing software.
The dashboard presents this information through charts, graphs, tables, and summary cards. Users can quickly understand how a website is performing without manually reviewing individual reports.
For example, an SEO reporting dashboard may display:
- Organic traffic
- Keyword rankings
- Search impressions
- Click-through rate
- Backlinks
- Referring domains
- Indexed pages
- Organic conversions
- Technical SEO issues
- Top-performing landing pages
The exact metrics depend on the website’s objectives. An ecommerce website may focus heavily on organic revenue and product-page performance, while a local business may prioritize local rankings, calls, directions, and location-based traffic.
Why Businesses Need an SEO Reporting Dashboard
SEO generates large amounts of information. Without a proper reporting system, it can become difficult to determine which numbers actually matter.
An SEO reporting dashboard simplifies this process by turning complex data into understandable information.
Centralizes SEO Data
SEO data often comes from several different platforms. Checking every platform individually can consume significant time.
A dashboard can bring important information together, allowing marketers to analyze traffic, rankings, technical health, and conversions from one place.
Makes Performance Easier to Understand
Raw numbers do not always provide meaningful insights. A dashboard can transform those numbers into visual trends.
For example, instead of simply showing that organic traffic increased from one month to another, a chart can demonstrate the growth pattern and help identify when major changes occurred.
Saves Reporting Time
Manual reporting can involve exporting spreadsheets, copying statistics, creating charts, and preparing presentations.
Automated dashboards can reduce much of this repetitive work. This is especially useful for SEO agencies that need to prepare reports for several clients regularly.
Supports Better Decision-Making
A good dashboard helps SEO teams answer practical questions:
- Which keywords are gaining visibility?
- Which pages are losing traffic?
- What content attracts the most organic visitors?
- Are technical problems affecting search performance?
- Which pages generate conversions?
- Is the backlink profile growing?
These insights can be used to determine the next SEO priorities.
Essential Metrics to Include in an SEO Reporting Dashboard
Not every available SEO metric belongs on a dashboard. Including too many statistics can make a report confusing.
The best approach is to select metrics that directly support the website’s goals.
| SEO Metric | What It Measures | Why It Matters |
| Organic Traffic | Visitors from search engines | Shows search visibility and audience growth |
| Keyword Rankings | Positions for target queries | Helps track ranking improvements |
| Impressions | Search appearances | Measures visibility in search results |
| Clicks | Search-result visits | Shows how effectively visibility generates traffic |
| CTR | Percentage of impressions receiving clicks | Helps evaluate search-result appeal |
| Backlinks | Links pointing to the website | Supports authority and discovery |
| Referring Domains | Unique websites linking to the site | Provides a broader view of link diversity |
| Conversions | Desired user actions | Connects SEO with business results |
| Indexed Pages | Pages available in search indexes | Helps monitor search accessibility |
| Core Web Vitals | Key user-experience signals | Supports technical and UX evaluation |
Organic Traffic and Search Visibility
Organic traffic is one of the most commonly monitored SEO metrics. It represents visitors who reach a website through unpaid search results.
Tracking organic traffic over time can reveal whether an SEO strategy is producing sustainable growth.
However, traffic should not be analyzed alone. A website can receive more visitors without generating more leads or sales. For this reason, traffic should be compared with engagement and conversion data.
Search impressions are also valuable. They show how frequently pages appear in search results. Increasing impressions can indicate that a website is becoming more visible for relevant queries, even when clicks have not increased significantly yet.
Keyword Ranking Performance
Keyword rankings remain useful for understanding search visibility.
A dashboard can track target keywords and show:
- Current position
- Previous position
- Ranking changes
- Search volume
- Search intent
- Ranking URL
- Estimated traffic opportunity
Rather than focusing only on individual rankings, SEO professionals should look for broader patterns.
For example, if many related keywords are improving simultaneously, it may indicate that a topic cluster or content strategy is gaining authority.
Focus on Valuable Keywords
Not every keyword has equal business value. A highly searched keyword may generate significant traffic but few conversions.
An effective SEO reporting dashboard should therefore help distinguish between keywords that generate visibility and keywords that contribute to meaningful business outcomes.
Measuring Click-Through Rate
Click-through rate, commonly known as CTR, measures how often users click a search result after seeing it.
A page can have strong rankings but receive fewer clicks than expected. This may happen because the title or description does not match user expectations or because competing results appear more attractive.
Monitoring CTR can help identify pages that may benefit from improvements to:
- Title tags
- Meta descriptions
- Search intent alignment
- Content relevance
- Structured data where appropriate
CTR should always be interpreted in context because search behavior varies by query type and position.
Tracking Backlinks and Off-Page SEO
Backlinks remain an important part of SEO analysis. An SEO reporting dashboard can provide an overview of the website’s link profile.
Important backlink metrics include the number of backlinks, referring domains, newly acquired links, lost links, and the quality and relevance of linking websites.
However, simply increasing the number of backlinks should not be the main objective. Relevant and trustworthy links are generally more valuable than large numbers of low-quality links.
Monitoring new and lost backlinks can also help SEO teams identify unusual changes in their link profile.
Technical SEO Health
A website may have excellent content but still experience search performance problems because of technical issues.
A useful SEO reporting dashboard can include technical indicators such as:
- Broken pages
- Redirect problems
- Crawl issues
- Indexing problems
- Duplicate content
- Missing metadata
- Mobile usability concerns
- Page-speed indicators
- Core Web Vitals
Technical data should not overwhelm the main report. Instead, the dashboard should highlight the most important problems and provide enough context to prioritize fixes.
Content Performance Reporting
Content is a major component of modern SEO. A dashboard should help determine which pages are performing well and which need improvement.
Useful content metrics include organic traffic, impressions, clicks, ranking keywords, engagement, conversions, and landing-page performance.
Identifying High-Performing Content
High-performing pages can reveal what topics, formats, and search intents resonate with an audience.
For example, if several educational guides consistently generate organic traffic and conversions, the business may decide to create additional content around related topics.
Finding Pages That Need Improvement
A dashboard can also reveal pages that have impressions but very few clicks. These pages may represent opportunities for optimization.
Similarly, pages with declining traffic can be reviewed to determine whether rankings, search intent, competition, content freshness, or technical problems have changed.
SEO Conversions and Business Results
One of the biggest weaknesses of poor SEO reporting is focusing only on rankings and traffic.
Businesses ultimately care about outcomes.
Depending on the website, conversions may include:
- Contact-form submissions
- Product purchases
- Account registrations
- Phone calls
- Newsletter subscriptions
- Demo requests
- Downloads
Connecting SEO traffic with conversions makes reporting more meaningful. It helps demonstrate how organic search contributes to actual business objectives.
Comparing SEO Performance Over Time
An SEO reporting dashboard becomes much more valuable when it provides historical comparisons.
Common comparison periods include:
- Month over month
- Quarter over quarter
- Year over year
- Before and after an SEO campaign
Historical comparisons help identify trends that may not be obvious when viewing a single reporting period.
For example, seasonal businesses may experience natural traffic fluctuations. Comparing the same period from previous years can provide a more accurate picture than comparing two consecutive months.
How to Build an Effective SEO Reporting Dashboard
Creating a useful dashboard starts with defining the purpose of the report.
Step 1: Define SEO Goals
Before selecting metrics, determine what the SEO campaign is trying to achieve.
The objective may be increasing organic traffic, generating leads, improving ecommerce revenue, increasing local visibility, or strengthening search visibility.
Step 2: Select Relevant KPIs
Choose key performance indicators that directly relate to those objectives.
Avoid adding metrics simply because they are available. Every major dashboard element should have a clear purpose.
Step 3: Connect Reliable Data Sources
Depending on your requirements, you may connect data from analytics platforms, search performance tools, rank trackers, backlink databases, and technical auditing tools.
Data accuracy should be checked before using the dashboard for important decisions.
Step 4: Organize Metrics Logically
Group related information together.
For example, one section can cover search visibility, another can cover keyword performance, another can cover technical SEO, and another can focus on conversions.
This structure makes reports easier to understand.
Step 5: Add Visualizations
Charts can make trends easier to identify.
Line charts are useful for traffic and ranking trends. Bar charts can compare pages or keyword groups, while tables can provide detailed information about individual URLs.
Step 6: Automate Recurring Reports
If the dashboard supports automation, schedule regular updates.
Automated reporting allows SEO professionals to spend more time analyzing results instead of repeatedly collecting data.
SEO Reporting Dashboard Best Practices
A successful dashboard should be simple, relevant, and actionable.
Keep the Dashboard Focused
Avoid displaying every available metric. Too much information can create confusion and make important changes difficult to notice.
Use Consistent Reporting Periods
Choose a consistent reporting schedule. Monthly reporting is common for ongoing SEO campaigns, while more frequent monitoring may be appropriate for large websites or active technical projects.
Add Context to Numbers
A number without context may be difficult to interpret.
Instead of reporting that organic traffic increased by 15%, explain what contributed to the increase and whether the growth aligns with the campaign’s goals.
Highlight Important Changes
Use the dashboard to identify major improvements, declines, opportunities, and problems.
This turns reporting into a decision-making tool rather than a simple collection of statistics.
Connect SEO Metrics With Business Objectives
Whenever possible, connect SEO activity with meaningful outcomes. Traffic and rankings are useful, but conversions and revenue often provide stronger evidence of business value.
Common Mistakes to Avoid
Several mistakes can reduce the effectiveness of an SEO reporting dashboard.
Tracking Too Many Metrics
A dashboard filled with dozens of numbers can be difficult to interpret. Focus on KPIs that support specific goals.
Focusing Only on Rankings
Rankings are useful but do not tell the entire story. Traffic, engagement, conversions, and technical performance should also be considered.
Ignoring Historical Data
Without historical comparisons, it can be difficult to determine whether performance is improving or declining.
Reporting Without Recommendations
A report should ideally explain what the data means and what actions should be considered next.
For example, instead of simply showing that a page lost traffic, investigate possible reasons and identify potential optimization steps.
Who Can Benefit From an SEO Reporting Dashboard?
An SEO reporting dashboard can be useful for many types of users.
SEO Agencies
Agencies can use dashboards to monitor multiple client campaigns and simplify recurring reporting.
In-House SEO Teams
Internal teams can track organic performance and communicate results with marketing managers and business leaders.
Freelancers
Freelance SEO professionals can use dashboards to present campaign progress clearly and professionally to clients.
Business Owners
Business owners may not need every technical SEO metric. A simplified dashboard can show organic traffic, leads, sales, rankings, and other high-level results.
The Future of SEO Reporting
SEO reporting is becoming increasingly focused on actionable insights rather than simple data collection.
Modern dashboards are moving toward automated data integration, clearer visualizations, anomaly detection, and more advanced analysis.
As search continues to evolve, businesses will also need to monitor more than traditional rankings. Search visibility across different platforms, content quality, user experience, and conversions will become increasingly important.
The goal is not to create the most complicated dashboard possible. The goal is to create a system that helps teams understand performance and make better decisions.
Final Thoughts
An SEO reporting dashboard is a powerful way to organize, monitor, and understand search engine optimization performance. By bringing important metrics into one centralized view, it can reduce manual reporting work and make SEO results easier to communicate.
The most effective dashboard does not simply display large amounts of data. It focuses on meaningful KPIs such as organic traffic, search visibility, keyword performance, backlinks, technical health, content performance, and conversions.
Whether you are an SEO agency, freelancer, marketer, or business owner, a well-designed dashboard can help transform SEO data into practical insights. With the right metrics, consistent reporting, and clear recommendations, your SEO reporting process can become more efficient, transparent, and results-focused.