SEO Reporting Dashboard: Guide to Tracking SEO Performance
Search engine optimization involves much more than choosing keywords and publishing content. To achieve sustainable organic growth, businesses need to understand how their SEO activities are performing and whether those activities are contributing to meaningful results. This is where an SEO reporting dashboard becomes valuable.
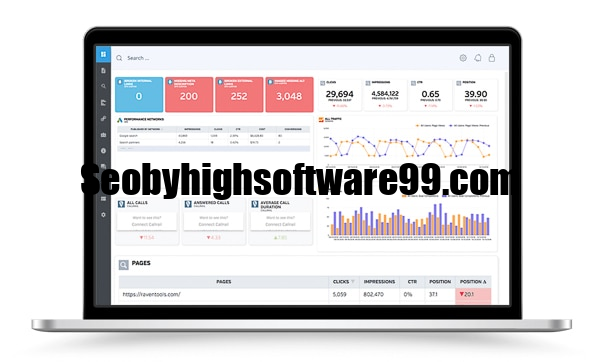
An SEO reporting dashboard brings essential SEO data into one centralized location. Instead of switching between different platforms to check rankings, organic traffic, clicks, impressions, conversions, backlinks, and technical issues, marketers can use a dashboard to review important information in a structured format.
A well-designed dashboard does not simply display statistics. It helps SEO professionals understand trends, identify problems, measure progress, communicate results, and make better strategic decisions. Whether you are an SEO agency managing multiple clients, a freelancer working on several websites, or a business owner monitoring your own website, an effective SEO reporting dashboard can make SEO performance easier to understand and manage.
What Is an SEO Reporting Dashboard?
An SEO reporting dashboard is a centralized system that collects and organizes search engine optimization data into a visual report. It may contain charts, graphs, tables, performance indicators, and historical comparisons that make SEO results easier to analyze.
Instead of reviewing isolated numbers, users can view multiple performance indicators together. This makes it easier to understand the relationship between rankings, search visibility, traffic, landing pages, conversions, content, and technical website health.
For example, a website may experience an increase in organic traffic. On its own, that sounds positive. However, when the data is analyzed through a dashboard, an SEO specialist may discover that most of the increase came from informational searches that generate very few leads.
Why Is an SEO Reporting Dashboard Important?
SEO campaigns generate large amounts of data. Search Console can provide search visibility information, analytics platforms can provide visitor behavior data, rank trackers can monitor keyword positions, and backlink tools can provide information about external links.
Checking each platform separately can consume significant time and make it difficult to see the complete picture.
An SEO reporting dashboard solves this problem by organizing relevant information in one place.
Better Decision-Making
SEO decisions should be based on evidence rather than assumptions. A dashboard makes important trends easier to identify.
For example, if several high-value keywords have lost rankings at the same time, an SEO specialist can investigate whether the cause is related to content quality, technical problems, competition, search intent, or another factor.
Faster Performance Monitoring
Manually collecting data every month can become repetitive. A centralized reporting system can simplify this process and allow marketers to spend more time analyzing information rather than gathering it.
Improved Client Communication
For agencies and freelancers, reporting is also a communication tool. Clients may not understand every SEO term, but they can usually understand clear charts showing traffic growth, keyword improvements, leads, and completed SEO activities.
A dashboard can make complex information much easier to present.
Easier Problem Detection
Sudden changes in traffic, rankings, indexing, or conversions can indicate potential problems. Regular dashboard reviews can help identify these changes before they become larger issues.
Key Metrics to Include in an SEO Reporting Dashboard
There is no universal list of metrics that every website must track. The most useful metrics depend on the website’s goals, industry, audience, and SEO strategy.
However, several metrics are commonly useful.
1. Organic Traffic
Organic traffic represents visitors who reach a website through unpaid search engine results.
Tracking organic users or sessions over time can help determine whether search visibility is translating into website visits.
Traffic should be analyzed by landing page, device, location, and other relevant dimensions when useful.
2. Search Impressions
Impressions indicate how frequently a website appears in search results.
An increase in impressions can indicate that a website is becoming visible for more searches. However, impressions do not necessarily mean that users are visiting the website.
Therefore, impressions should be analyzed alongside clicks and CTR.
3. Organic Clicks
Clicks show how many users selected a website’s search result.
Tracking clicks alongside impressions provides a stronger understanding of search performance. If impressions rise but clicks remain flat, there may be an opportunity to improve search-result presentation.
4. Click-Through Rate
Click-through rate, commonly called CTR, measures the percentage of impressions that result in clicks.
The basic formula is:
CTR = (Clicks ÷ Impressions) × 100
CTR can vary significantly depending on search position, query type, industry, SERP features, and search intent. For this reason, it is better to compare CTR trends rather than rely on one universal benchmark.
5. Keyword Rankings
Keyword rankings show where a website appears for selected search queries.
A dashboard can track:
- Current keyword positions
- Ranking increases
- Ranking decreases
- Keywords entering the top 10
- Keywords entering the top 3
- Keywords losing first-page visibility
- Branded keywords
- Non-branded keywords
Keyword tracking becomes more useful when it focuses on commercially and strategically important terms rather than simply collecting a large number of keywords.
6. Conversions
Conversions connect SEO performance with business objectives.
Depending on the website, conversions might include purchases, contact forms, quote requests, registrations, downloads, or other valuable actions.
A website receiving 50,000 organic visitors but generating very few meaningful actions may need a different strategy from a website receiving 5,000 highly qualified visitors that generate substantial business value.
SEO Reporting Dashboard Metrics Table
| SEO Metric | What It Measures | Why It Matters | Recommended Review |
| Organic Traffic | Visitors from unpaid search | Shows search-driven website visits | Weekly/Monthly |
| Impressions | Search-result visibility | Indicates how often pages appear | Weekly/Monthly |
| Clicks | Search-result visits | Measures actual search traffic | Weekly/Monthly |
| CTR | Click percentage from impressions | Helps evaluate search-result appeal | Monthly |
| Keyword Rankings | Search positions | Tracks visibility for target queries | Weekly/Monthly |
| Conversions | Valuable user actions | Connects SEO with business results | Monthly |
The purpose of this table is not to suggest that every website needs every metric. Instead, it provides a starting point for building a dashboard around specific goals.
Technical SEO Reporting
Technical SEO is an important part of website performance. Even excellent content may struggle to perform if search engines cannot properly crawl, render, or index important pages.
An SEO reporting dashboard can monitor technical indicators and highlight potential problems.
Important areas may include:
Crawl Errors
Crawl errors can prevent search engines from successfully accessing certain URLs. Regular monitoring can help identify broken pages and other accessibility problems.
Indexing Issues
Not every page on a website needs to appear in search results, but important pages should generally be accessible to search engines when appropriate.
Monitoring indexed pages can help identify unexpected changes.
Broken Links
Internal and external broken links can create poor user experiences and may interfere with website navigation.
Redirect Problems
Incorrect or unnecessary redirects can create technical complications. Monitoring redirect-related issues can help maintain a cleaner website structure.
Core Web Vitals
Page experience metrics can provide useful information about loading performance, responsiveness, and visual stability.
Technical reporting should focus on issues that have a meaningful impact rather than treating every technical warning as equally important.
Keyword Performance Tracking
Keyword data is one of the most recognizable parts of SEO reporting, but it should be interpreted carefully.
A keyword moving from position 20 to position 12 is an improvement, but it may still generate limited traffic. Similarly, a keyword ranking in position three may not be especially valuable if the search query has little commercial relevance.
A strong dashboard groups keywords according to purpose.
For example:
| Keyword Group | Purpose | What to Monitor |
| Commercial | Users researching products or services | Rankings and conversions |
| Informational | Users looking for answers | Traffic and engagement |
| Branded | Searches containing the brand | Visibility and CTR |
| Local | Location-specific searches | Visibility and leads |
| Transactional | Users ready to take action | Rankings and conversions |
This approach provides more strategic insight than reporting a single average ranking.
Organic Traffic and Conversion Reporting
Traffic is an important SEO indicator, but it is not the final objective for most businesses. An SEO reporting dashboard should ideally connect organic traffic with conversions.
For example, imagine that organic traffic increases by 30% but leads increase by only 2%. This may indicate that the additional traffic is not sufficiently relevant or that landing pages are not converting effectively.
On the other hand, if traffic increases by 10% while qualified leads increase by 35%, the campaign may be attracting substantially more valuable visitors. This is why traffic and conversions should be evaluated together.
Content Performance Monitoring
Content marketing and SEO are closely connected. However, simply publishing a large number of articles does not guarantee organic growth.
A dashboard can help determine which content assets are actually performing.
Useful content metrics include:
- Organic traffic
- Search clicks
- Impressions
- Ranking keywords
- Conversion activity
- Top landing pages
- Content growth over time
- Pages losing organic visibility
Content reporting can also reveal opportunities for updating older articles.
For example, if an article previously generated significant traffic but has gradually declined, an SEO specialist can investigate whether the content has become outdated, competitors have created stronger resources, or search intent has changed.
Backlink and Authority Reporting
Backlinks remain an important part of SEO analysis. A reporting dashboard can monitor how a website’s backlink profile changes over time.
Instead of focusing only on total backlinks, consider tracking referring domains, newly acquired links, lost links, and important linking websites.
A simple backlink reporting section could look like this:
| Backlink Metric | Purpose |
| New Backlinks | Tracks recently acquired links |
| Lost Backlinks | Identifies links that disappeared |
| Referring Domains | Measures unique linking websites |
| High-Value Links | Highlights important referring sources |
| Link Growth | Shows changes over time |
The objective should be to understand the quality and relevance of the link profile rather than simply maximizing the number of links.
Competitor Performance Tracking
SEO does not happen in isolation. Competitors can publish new content, improve existing pages, acquire backlinks, and change their strategies. A dashboard can therefore include selected competitor indicators. Competitor reporting might examine keyword visibility, ranking changes, content coverage, and referring-domain trends.
This information can reveal gaps that deserve attention. For instance, if competitors consistently rank for an important topic and your website has no relevant resource, that may represent a content opportunity. However, competitor data should support strategy rather than encourage blind copying.
How to Create an Effective SEO Reporting Dashboard
Building a useful dashboard requires more than adding charts.
Step 1: Define Your Goals
Start by identifying what SEO is expected to achieve.
Possible goals include increasing qualified traffic, generating leads, improving e-commerce revenue, increasing visibility, or expanding into a new market.
Your goals should determine which metrics appear in the dashboard.
Step 2: Choose the Right Metrics
Select KPIs that directly relate to those objectives.
Avoid adding metrics simply because a tool provides them.
If a metric does not help answer an important business or SEO question, it may not belong on the main dashboard.
Step 3: Organize the Dashboard
Use clear sections.
A practical layout could include:
SEO Overview → Keyword Performance → Organic Traffic → Conversions → Content → Technical SEO → Backlinks
This structure allows users to start with the big picture and then move into specific areas.
Step 4: Add Historical Comparisons
Current numbers become much more meaningful when compared with previous results.
Use monthly, quarterly, or year-over-year comparisons depending on the website and its seasonality.
Step 5: Add Explanations
Do not assume that charts explain themselves. Add short notes about major changes, such as a website migration, content update, technical fix, algorithm change, or successful campaign. Context helps stakeholders understand the reason behind performance changes.
SEO Reporting Dashboard for Agencies
SEO agencies often need dashboards that balance simplicity with detailed information. A client-facing dashboard should provide a clear overview of campaign performance without overwhelming the client with technical terminology.
A useful agency report can include:
- Organic traffic trends
- Important keyword movements
- Search visibility
- Leads or conversions
- Top-performing content
- Backlink progress
- Technical SEO highlights
- Completed work
- Next-month priorities
The final section is particularly important. Clients generally want to know not only what happened but also what the SEO team plans to do next.
SEO Reporting Dashboard for Small Businesses
Small businesses usually benefit from simpler reporting.
There is no need to fill a dashboard with every available SEO metric. Instead, focus on the information that directly supports business decisions.
A small-business dashboard may emphasize organic traffic, local visibility, important keywords, website leads, conversions, top landing pages, and major technical issues.
Keeping the dashboard simple can make SEO easier for non-technical business owners to understand.
Common SEO Reporting Dashboard Mistakes
Tracking Too Many Metrics
A dashboard packed with information can become difficult to understand.
Choose the metrics that matter most and move detailed information into separate reports when necessary.
Focusing Only on Rankings
Rankings are useful, but they should not be treated as the final measurement of SEO success.
Traffic, qualified visitors, leads, sales, and other business outcomes provide additional context.
Ignoring Search Intent
A ranking improvement is not necessarily valuable if the keyword does not match the audience’s needs.
Always consider whether the traffic generated by a keyword is relevant.
Reporting Without Context
Simply saying that traffic increased or decreased does not explain why.
Reports should highlight important factors and provide a reasonable interpretation of major changes.
Ignoring Negative Results
SEO reporting should be transparent. Declines are not automatically evidence of campaign failure.
A decrease can reveal useful information and create an opportunity for improvement.
Best Practices for SEO Reporting
To create more useful reports, follow a few basic principles.
Keep Reports Goal-Oriented
Every important metric should have a reason for being included.
Use Consistent Reporting Periods
Consistent timeframes make trends easier to evaluate.
Combine SEO and Business Data
Where possible, connect search performance with leads, sales, or other meaningful outcomes.
Highlight Trends Instead of Isolated Numbers
A single day’s ranking or traffic figure may not tell the full story. Trends usually provide more useful information.
Make Reports Easy to Understand
Use clear headings, simple explanations, and logical organization.
Turn Insights Into Actions
Every significant finding should lead to a question or possible action.
For example, declining organic traffic may lead to content updates, technical investigations, internal-link improvements, or further keyword research.
Final Thoughts
An SEO reporting dashboard is much more than a collection of charts and numbers. It is a practical system for understanding search performance, identifying opportunities, detecting problems, and connecting SEO activity with broader business objectives.
The strongest dashboards focus on meaningful information rather than overwhelming users with unnecessary metrics. Organic traffic, clicks, impressions, rankings, conversions, content performance, backlinks, and technical health can provide a strong foundation when they are organized around clear goals.


